Event Details

About this Event
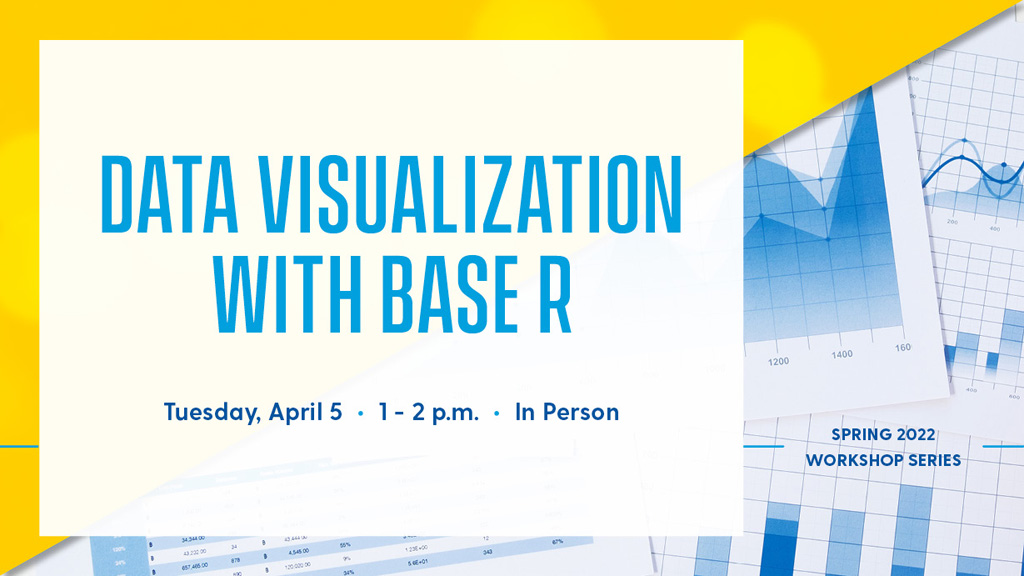
Data visualizations can make the story behind your data easier for others to understand.
During this workshop, explore how to use R—an open source statistical tool—to create versatile visualizations for coursework, outreach or publications. You will get hands-on experience with the platform as you create plots from sample datasets, and learn how to customize your plots to ensure readability, formatting and visual storytelling.
Daniel C. Peart, data services librarian, will lead the workshop.
This in-person workshop is open to UD students, faculty and staff. It is co-sponsored by the Graduate College. Those with little to no R experience are encouraged to attend.
Registration is required as seating is limited.
All attendees will need to show ID upon arrival. In addition, all attendees will need to complete the UD Daily Health Check the day of the event, and show the green icon reflecting health clearance upon arrival. Face masks are required for this workshop due to its classroom setting.
If necessitated by the rapidly changing nature of the COVID-19 pandemic, this in-person workshop may be shifted to a virtual format, postponed or canceled. Attendees will be notified by email if this occurs.
---
If you are interested in this workshop, you may also be interested in Data Cleaning and Summary Statistics with R on February 22.
